How Many Televisions Are There In The US?
The number of televisions in the US is significant, with nearly 97% of US households owning at least one TV, which is used for monster television programming and more, and this prevalence highlights the enduring importance of broadcast and streaming media in American homes. At monstertelevision.com, explore comprehensive data, reviews, and community discussions about your favorite shows and the latest trends. Dive into TV viewership, monster entertainment, and over-the-air TV insights, all in one place.
1. What Is The Total Number of TV Households in the US?
According to Nielsen’s TV universe estimates for 2023-24, the US has 125 million TV households. This represents a 1% increase from the previous year, highlighting the continued prevalence of television in American homes. This vast reach underscores the importance of television as a primary source of entertainment and information for a significant portion of the US population.
The ubiquity of TV households in the US reflects the enduring appeal of broadcast and streaming media. Despite the rise of alternative entertainment platforms, such as online video and gaming, television remains a central fixture in most American homes. This is due to several factors, including the wide variety of programming available, the convenience of watching TV on a large screen, and the shared experience of watching TV with family and friends. The consistent growth in TV households underscores the medium’s ability to adapt to changing consumer preferences and technological advancements.
The widespread adoption of smart TVs and connected devices has further solidified television’s role in the digital age. These technologies have enabled viewers to access a vast array of content from various sources, including streaming services, on-demand platforms, and traditional broadcast channels. This convergence of traditional and digital media has created a more dynamic and personalized viewing experience, contributing to the continued relevance of television in the lives of Americans.
2. How Many US Households Have Televisions?
Approximately 97% of US households have at least one television. According to Nielsen, this equates to almost 315.3 million people living in TV households. This high percentage underscores the importance of television as a central source of entertainment and information for the vast majority of the US population.
The prevalence of televisions in US households is a testament to the medium’s enduring appeal and adaptability. Despite the rise of alternative entertainment platforms, such as online streaming services and social media, television remains a staple in most American homes. This is due to several factors, including the wide variety of programming available, the convenience of watching TV on a large screen, and the shared experience of watching TV with family and friends.
The television landscape has evolved significantly in recent years, with the advent of smart TVs and connected devices. These technologies have enabled viewers to access a vast array of content from various sources, including streaming services, on-demand platforms, and traditional broadcast channels. This convergence of traditional and digital media has created a more dynamic and personalized viewing experience, contributing to the continued relevance of television in the lives of Americans.
Furthermore, the availability of high-quality content, ranging from blockbuster movies to critically acclaimed TV series, has further fueled the demand for televisions. The rise of streaming services like Netflix, Hulu, and Amazon Prime Video has provided viewers with unprecedented access to a vast library of content, making it easier than ever to find something to watch.
US TV households with monster television programming
3. What Percentage of US Homes Use Over-The-Air (OTA) Antennas?
As of November 2023, Nielsen reported that over 18% of US TV households have at least one TV set enabled to receive free, broadcast programming. This means they are using over-the-air (OTA) antennas. While many supplement this with other content sources, it’s a consistent segment of the market.
OTA antennas provide access to free, broadcast television channels, allowing viewers to watch local news, sports, and entertainment programming without paying for cable or satellite subscriptions. This option has become increasingly popular in recent years, as consumers seek ways to reduce their monthly expenses and cut the cord from traditional pay-TV services.
The availability of high-definition (HD) broadcasts over the air has also contributed to the resurgence of OTA antennas. With the advent of digital television, broadcasters are now able to transmit high-quality signals that can be received by OTA antennas, providing viewers with a superior viewing experience compared to the analog broadcasts of the past.
Furthermore, the simplicity and affordability of OTA antennas make them an attractive option for budget-conscious consumers. Unlike cable or satellite subscriptions, which require monthly fees and long-term contracts, OTA antennas can be purchased for a one-time cost and provide access to free, over-the-air programming.
4. How Many US Households Rely Solely on Digital Antennas?
While the exact number of US households that rely solely on digital antennas is not explicitly stated, Nielsen indicates that few homes rely solely on digital antennas for TV content. Most supplement their OTA access with content from other sources, such as streaming services. This highlights that while OTA is a valuable option, it’s often used in conjunction with other viewing methods.
The reasons for this trend are multifaceted. While OTA antennas provide access to free, over-the-air programming, the number of channels available may be limited compared to cable or satellite subscriptions. Additionally, OTA antennas may not provide access to premium content, such as movie channels or sports networks, which are often available through paid TV services.
As a result, many households choose to supplement their OTA access with content from streaming services like Netflix, Hulu, or Amazon Prime Video. These services offer a vast library of on-demand content, including movies, TV shows, and original programming, providing viewers with a wider range of entertainment options.
Furthermore, the convenience and flexibility of streaming services make them an attractive option for busy households. Viewers can watch their favorite shows and movies anytime, anywhere, on a variety of devices, including smartphones, tablets, and smart TVs.
5. What Percentage of TV Homes Watch Linear Programming?
Approximately 92% of TV households, regardless of classification, watched some form of linear programming between October 2022 and October 2023. This indicates a strong and consistent engagement with traditional, scheduled TV programming. Linear programming refers to traditional TV channels that broadcast content at set times, as opposed to on-demand streaming services.
The enduring popularity of linear programming can be attributed to several factors. For many viewers, watching live TV is a habit and a source of comfort. Linear programming provides a sense of structure and predictability, with familiar shows and channels that viewers can rely on for entertainment and information.
Additionally, live TV is often the preferred way to watch certain types of content, such as sports, news, and live events. These events are often best experienced in real-time, with the excitement and immediacy of live broadcasts adding to the viewing experience.
Furthermore, linear programming offers a social aspect that is often lacking in on-demand streaming services. Watching live TV with family and friends can be a shared experience, with viewers commenting on the action, sharing their reactions, and bonding over their favorite shows and events.
6. How Does Connected TV (CTV) Usage Compare to OTA Viewing?
Connected TV (CTV) usage accounts for just over 32% of TV usage among adults 18 and older. While this is a significant portion, it’s important to remember that it doesn’t capture OTA viewing. CTV refers to any television that accesses content from the internet, typically through streaming apps.
CTV usage has been steadily increasing in recent years, driven by the growing popularity of streaming services like Netflix, Hulu, and Amazon Prime Video. These services offer a vast library of on-demand content, providing viewers with a wide range of entertainment options at their fingertips.
However, it’s important to note that CTV usage does not encompass OTA viewing. OTA antennas provide access to free, over-the-air programming, which is not captured by CTV data. This means that the total number of viewers who watch television is likely higher than what CTV data alone would suggest.
Furthermore, OTA viewing is often more prevalent in certain demographics and geographic areas. For example, households with lower incomes or those located in rural areas may be more likely to rely on OTA antennas for their television viewing needs.
7. What Is The Significance of OTA Homes for Audience Measurement?
The steadfast portion of homes that access content with digital antennas is a critical audience measurement consideration, especially as big data gains momentum as a measurement source amid rising connected TV (CTV) usage. Big data sources don’t capture OTA viewing, making it essential to have accurate data on this segment of the audience.
Audience measurement is the process of tracking and analyzing who is watching what on television. This information is used by advertisers and media companies to make informed decisions about programming, advertising placement, and content distribution.
Accurate audience measurement is essential for ensuring that advertisers are reaching their target audiences and that media companies are generating revenue from their programming. However, traditional audience measurement methods, such as Nielsen ratings, have been criticized for being inaccurate and outdated.
Big data offers the potential to improve audience measurement by providing more granular and comprehensive data on viewing habits. However, big data sources typically do not capture OTA viewing, which means that a significant portion of the audience is not being accurately measured.
8. How Many US Homes Access Free TV Programming Using Digital Antennas?
Nearly 23 million US homes access free TV programming using digital antennas. This number includes 18.125 million OTA households and an additional 4.625 million cable and satellite TV homes that also have OTA-capable TV sets. This is a substantial portion of the TV-viewing population.
The large number of homes that access free TV programming using digital antennas underscores the continued appeal of over-the-air broadcasting. Despite the rise of cable, satellite, and streaming services, many viewers still value the ability to watch local news, sports, and entertainment programming for free.
Digital antennas have become increasingly popular in recent years, as consumers seek ways to reduce their monthly expenses and cut the cord from traditional pay-TV services. With the advent of digital television, broadcasters are now able to transmit high-quality signals that can be received by digital antennas, providing viewers with a superior viewing experience compared to the analog broadcasts of the past.
Furthermore, the simplicity and affordability of digital antennas make them an attractive option for budget-conscious consumers. Unlike cable or satellite subscriptions, which require monthly fees and long-term contracts, digital antennas can be purchased for a one-time cost and provide access to free, over-the-air programming.
9. What Makes OTA Audience Data Valuable to Advertisers and Agencies?
OTA audience data, combined with person-level demographic information, provides advertisers and agencies with insight that’s out of reach of big data. This data helps them understand the viewing habits and preferences of OTA viewers, allowing for more targeted and effective advertising campaigns.
Advertisers and agencies rely on audience data to make informed decisions about where to place their advertising dollars. They want to reach the right audience with the right message at the right time. OTA audience data provides valuable insights into the demographics, viewing habits, and preferences of OTA viewers, allowing advertisers and agencies to tailor their campaigns to this specific audience.
For example, OTA audience data can reveal that a certain percentage of OTA households are home to one person, while another percentage are home to three or more people. This information can be used to target advertising campaigns to specific household sizes, ensuring that the message resonates with the intended audience.
Additionally, OTA audience data can provide insights into the income levels of OTA viewers. This information can be used to target advertising campaigns to specific income brackets, ensuring that the message is relevant to the financial situation of the viewer.
10. Where Is OTA Usage Highest in the US?
Outside of the national average, OTA usage plays a much larger role in select cities. In Houston, for example, more than 27% of TV homes have at least one TV set enabled to receive free, broadcast programming, with nearly 24% using their antennas as the primary means of watching TV. The percentage of OTA use even surpasses 30% in select designated market areas (DMAs), with Oklahoma City topping the list: 37.3% of TV homes in this market have at least one OTA-enabled TV set.
The higher rates of OTA usage in certain cities and DMAs can be attributed to a variety of factors. One factor is the availability of strong over-the-air signals in these areas. In cities with a large number of broadcast towers, OTA viewers are more likely to receive a clear and reliable signal.
Another factor is the demographic makeup of these areas. Cities with a higher percentage of low-income households may have a higher rate of OTA usage, as these households may be more likely to rely on free over-the-air programming.
Additionally, some cities may have a stronger tradition of over-the-air broadcasting. In these cities, viewers may be more familiar with OTA antennas and more likely to use them for their television viewing needs.
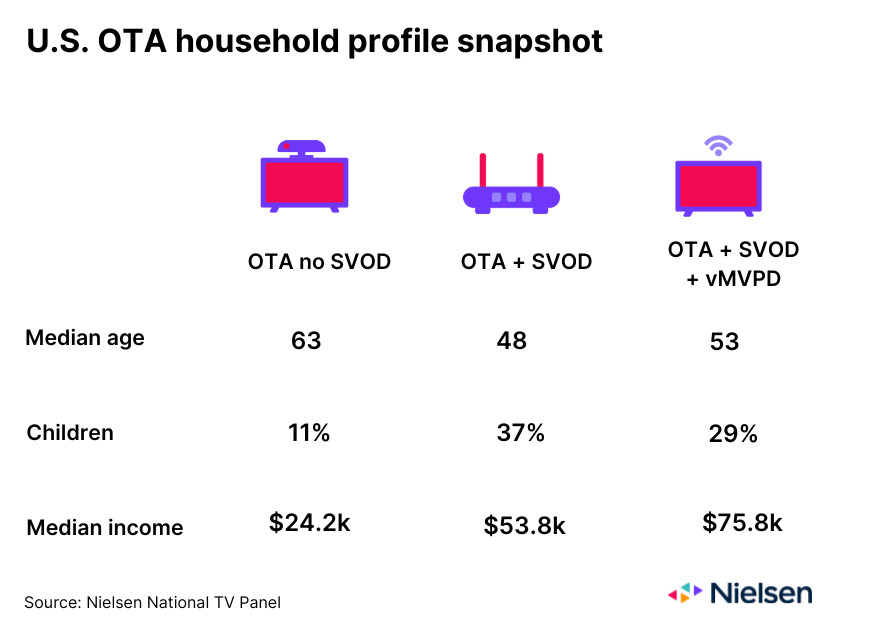
11. How Does the Type of TV Service Impact Household Demographics?
Household demographics vary based on the type of TV service they use. For example, nearly 60% of OTA households that don’t subscribe to a subscription video on demand (SVOD) service are households of one person, while 45% of OTA households that subscribe to an SVOD service but don’t use a virtual multichannel video programming distributor (vMVPD) are home to three or more people. From an income perspective, however, OTA households that subscribe to an SVOD service and use a vMVPD are the biggest earners.
These demographic differences highlight the importance of understanding the nuances of the TV-viewing landscape. Advertisers and agencies need to be aware of these differences in order to effectively target their advertising campaigns.
For example, if an advertiser is targeting single-person households, they may want to focus their advertising efforts on OTA households that don’t subscribe to an SVOD service. On the other hand, if an advertiser is targeting larger households, they may want to focus their advertising efforts on OTA households that subscribe to an SVOD service but don’t use a vMVPD.
Furthermore, advertisers and agencies need to be aware of the income levels of different types of TV households. If an advertiser is targeting high-income households, they may want to focus their advertising efforts on OTA households that subscribe to an SVOD service and use a vMVPD.
12. What Are the Key Considerations for TV Audience Measurement Today?
As audience measurement evolves to include data from smart TVs and cable boxes, it will be critical that people, not big data, remain the center of the equation. Accurate audience measurement requires a comprehensive understanding of viewing habits across all platforms, including OTA, cable, satellite, and streaming.
The rise of big data has created new opportunities for audience measurement, but it has also raised new challenges. Big data sources can provide more granular and comprehensive data on viewing habits, but they can also be inaccurate and incomplete.
It is important to remember that big data is only as good as the data that goes into it. If the data is biased or incomplete, the results will be skewed. Therefore, it is essential to use a variety of data sources and methods to ensure that audience measurement is accurate and reliable.
Additionally, it is important to consider the privacy implications of audience measurement. Viewers have a right to know how their data is being collected and used, and they should have the opportunity to opt out of data collection if they choose.
Monster Television: Your Ultimate Source for TV Insights
At monstertelevision.com, we provide in-depth analysis, up-to-date news, and a vibrant community for fans of TV shows with monsters. Explore our reviews, behind-the-scenes information, and fan theories to deepen your appreciation for the genre. Join our community to connect with fellow enthusiasts and share your thoughts.
Discover the Latest Trends in Monster Television
Stay informed about the latest developments in monster television with our comprehensive coverage. We provide detailed episode summaries, cast interviews, and exclusive content that you won’t find anywhere else. Whether you’re a long-time fan or new to the genre, monstertelevision.com is your go-to source for all things monster TV.
Join the Monster Television Community
Connect with other fans and share your passion for monster television in our active community forums. Discuss your favorite shows, debate fan theories, and discover new series to watch. Our community is a welcoming space for fans of all ages and backgrounds.
Ready to dive deeper into the world of monster television? Visit monstertelevision.com today to read our reviews, catch up on the latest news, and join our community of passionate fans. Don’t miss out on the ultimate resource for all things monster TV!
Address: 900 S Broadway, Los Angeles, CA 90015, United States
Phone: +1 (213) 740-2700
Website: monstertelevision.com
FAQ: Understanding Television Viewership in the US
1. How Many Televisions Are in the US Today?
Nearly 97% of US households own at least one television. This underscores television’s enduring importance as a primary source of entertainment and information for a significant portion of the US population.
2. What Does It Mean to Access TV Content Over-The-Air (OTA)?
Accessing TV content OTA means using a digital antenna to receive free, broadcast programming. This allows viewers to watch local news, sports, and entertainment without paying for cable or satellite subscriptions.
3. Is Over-The-Air (OTA) Viewing Still Relevant Today?
Yes, OTA viewing remains relevant, with over 18% of US TV households using antennas to access free, broadcast programming. While many supplement this with other sources, it’s a consistent segment of the market.
4. How Do I Find New Monster TV Shows to Watch?
Visit monstertelevision.com to explore our reviews, behind-the-scenes information, and community discussions about your favorite shows and the latest trends in monster television.
5. What Should Advertisers Know About TV Audience Measurement?
As audience measurement evolves, it’s critical that people, not just big data, remain the center of the equation. Accurate measurement requires a comprehensive understanding of viewing habits across all platforms.
6. Are There US Cities Where More People Watch TV Over-The-Air?
Yes, outside of the national average, OTA usage plays a larger role in select cities. In Houston, over 27% of TV homes have at least one TV set enabled to receive free, broadcast programming.
7. Where Can I Find Information About Monster Television in the US?
Visit monstertelevision.com to read our reviews, catch up on the latest news, and join our community of passionate fans. We provide in-depth analysis, up-to-date news, and a vibrant community for fans of TV shows with monsters.
8. What is Linear Programming?
Linear programming refers to traditional TV channels that broadcast content at set times, as opposed to on-demand streaming services.
9. Where Can I Connect with Other Fans of TV Shows About Monsters?
Join the Monster Television community at monstertelevision.com to connect with other fans, discuss your favorite shows, and discover new series to watch.
10. What is the Importance of Knowing TV-Viewership Data?
Understanding TV-viewership data helps advertisers and media companies make informed decisions about programming, advertising placement, and content distribution, ensuring that they are reaching their target audiences effectively.